Support vector machine nonlinear regression modeling of pressure sensor
The output characteristics of pressure sensors are easily affected by environmental factors, especially temperature changes. To solve this problem, a nonlinear compensation model for the output characteristics of pressure sensor using support vector machine (SVM) is proposed. The calibration model uses the regression algorithm of SVM to approximate the characteristics of the nonlinear function, and the calibration model of the nonlinear mapping relationship between the output characteristics of the pressure sensor and its actual voltage value is established to realize the calibration of the pressure sensor. The example shows that the method can effectively reduce the influence of temperature change on the output of the sensor, and the calibrated pressure sensor has higher measurement accuracy and temperature stability.
0 quote
In the data acquisition and measurement control system, the pressure sensor has been widely used because of its advantages of simple structure, high sensitivity, good dynamic response and strong anti-overload ability. However, the pressure sensor is more sensitive to environmental parameters such as temperature, and these factors are always interrelated in the actual environment, which brings errors to the measurement results and seriously affects the linearity of the sensor, resulting in a great decline in accuracy. In order to improve the performance of the sensor, it must be calibrated. However, the influence of various interference factors on the measurement results is difficult to be described by simple function expression, so it is often cumbersome to establish the output characteristic correction model of the sensor and solve the model. support vector machine (SVM) is a machine learning algorithm proposed in the mid-1990s, which is based on statistical learning theory. Traditional learning algorithms (such as neural networks) adopt the empirical risk minimization (ERM) criterion, which is prone to overfitting or underfitting. SVM, based on the structural risk minimization (SRM) criterion, has shown much better performance than existing methods for limited sample learning problems. At the same time, SVM algorithm is a convex quadratic optimization problem, which can ensure that the extreme solution is the global optimal solution, and can solve the problems of small samples, nonlinear and high dimension well. In this paper, a SVM nonlinear regression model for pressure sensor is proposed to correct the nonlinear error of the sensor.
1 SVM calibration sensor principle
1.1 Correction principle The mathematical model of the pressure sensor is set as

Where, is the target parameter to be measured, is the temperature value, and y is the output of the sensor. Formula (1) store inverse function, that is, X=f - (Y, T), but its inverse function is difficult to use a specific function to describe, you can use SV M to approximate this nonlinear function.
The principle of SVM correction model is as follows: The input data is mapped to a high-dimensional space using nonlinear mapping, and the regression analysis is carried out after the transformation of the high-dimensional space. The output of the target parameter measurement sensor and the output of non-target parameter sensitive elements such as temperature change are taken as the input of the SVM calibration model, and the pressure calibration value is taken as the output of the model. In this way, the influence of non-target parameters such as temperature change on the measured target parameters can be reduced. The principle of calibrating pressure sensor with SV M.
1.2 SVM nonlinear regression model
The use of SVM calibration model to calibrate pressure sensors is essentially a nonlinear regression problem-5. That is, using mathematical methods to establish the regression relationship between the dependent variable and the independent variable function expression (regression equation). Apply SVM to
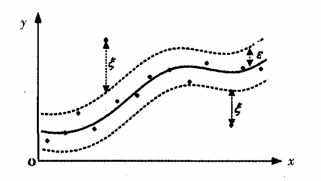
In regression analysis, it is necessary to define an insensitive loss function s, which can ignore errors in the range above and below the true value. The variable measures the cost of the error at the training point, and the error in the S-insensitive region is 0. The solution of the loss function is characterized by the minimization of the function, and the use of insensitive functions can ensure the existence of global minima and the optimization of reliable generalization bounds.

Figure 2 shows the insensitive zone function of the nonlinear regression function.
The following SVM nonlinear regression model can be used to build the nonlinear regression model of the pressure sensor.


Its constraint conditions are

The first term in equation (3) makes the regression function smoother, helping to improve generalization, and the second term reduces error. C is the penalty coefficient, and the greater C is, the greater the penalty is for the data sample whose training error is greater than s. s specifies the error requirements of regression function and output. The smaller the error, the smaller the error between regression function and output, and the higher the estimation accuracy.
At present, the choice of the value of the penalty coefficient C is difficult to determine by theoretical method, and it should be determined according to the requirements of practical application. The criterion for adjusting parameters is: to check whether the correction of a particular weight does indeed reduce the error, and to increase or decrease the operation according to the actual situation until the design requirements are met.
For the above optimization problem, equation (3) can be converted to its dual problem for solving

Its constraint conditions are

In summary, the process of using SVM regression model to correct sensors is as follows:
1) Obtain calibration data samples, compose training samples and test samples, and normalize the data;
2) Select the appropriate kernel function, determine the accuracy error s and the related parameters of the kernel function, and train the SVM model with training samples to determine the value of and b;
3) When the output and expected error value meet the requirements, the training ends; Go to step (4), otherwise, readjust the SV M parameters, go to step (2);
4) Use the test sample to check the calibration mold. If the error requirement is met, determine the SV M mold parameters, end, otherwise, go to step (2).
2 Sensor calibration
2.1 Sensor calibration data and pre-processing
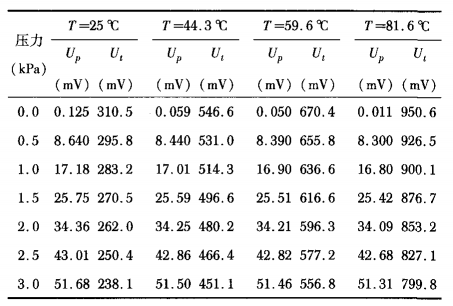
Input and output calibration values of sensors in different working environments in literature [8] are selected for training samples. Specific data are shown in Table 1, where output voltage of pressure sensor and output voltage of temperature sensor are respectively.

Table 1 Sensor input and output calibration values
In order to avoid the existence of singular sample data in the sample and facilitate the program to process the data, it is necessary to conduct normalization preprocessing of the sample. The normalization function is as follows.

2.2 SVM regression modeling
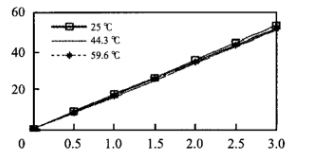
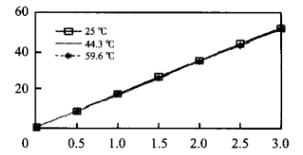
Among the normalized calibration values, the calibration values at 25,44.3, 59.6 ℃ were selected as SVM training samples, and the calibration values at 81.6 ℃ were selected as SVM verification samples. In Matlab, the function in SVM toolbox is used to write the training program, the appropriate SVM parameters are selected and the training sample is input to SVM for training, and the simulation is carried out in Matlab. The output curves of the sensor at 25,44.3, 59.6℃ before and after correction are shown in FIG.3 and FIG. 4.

Figure 3 Output characteristic curve of pressure sensor before correction

Figure 4 Output characteristic curve of pressure sensor after correction
It can be seen from the curves in FIG. 3 and FIG. 4 that the linearity of the sensor output curve corrected by SVM regression model is improved, the regression accuracy is also high, and the maximum absolute fluctuation of the processed data is greatly reduced. It can be seen that after correcting the model, the output characteristics and stability of the pressure sensor are improved under the same temperature change.
3 Conclusion
SVM is used to construct the nonlinear regression model of the sensor, which compensates the temperature effect of the sensor and corrects the nonlinear error. This method has the advantages of fast modeling speed and high correction accuracy. The application results show that compared with other algorithms, the algorithm has some advantages in correction accuracy and generalization. However, the selection of kernel function and the determination of its parameters in the algorithm have no definite theoretical basis and need to be further studied. It can also be seen that proper pre-processing of the original data can improve the accuracy of the correction model.
References:
[1] C ristianini N, Shaw e-Taylo J. Introduction to support vector machines [M]. Li Guozheng, Wang Meng, Zeng Huajun, Trans. Beijing: Publishing House of Electronics Industry, 2004.
[2] V apnik V N. The nature of statistical learning theory [M]. Zhang Xuegong, Translator. Beijing: Tsinghua University Press, 2008.
[3] V apnik V. Statistical learning theory [M]. N ew Y ork: Spr i nger, 1 99 8.
[4] Li Guoyu, Sun Yicai, Pan Guofeng, et al. Information fusion of pressure sensor based on BP network [J]. Chinese Journal of Scientific Instrument, 2005, 26 (2) : 168-171.
[5] Bai Peng, Zhang Xibin. Pressure sensor calibration model based on support vector machine [J]. Journal of Air Force Engineering University: Natural Science Edition, 2007, 8 (5) : 37-40.
[6] Zhang Xuegong. On Statistical Learning Theory and Support Vector Machine [J]. Acta Automatica Sinica, 2000, 26 (1) : 32-42.
[7] Deng Naiyang, Tian Yingjie. A new method in data mining - Support vector Machine [M]. Beijing: Science Press, 2004.
[8] Liang Weifeng. Temperature compensation of pressure sensor based on least square support vector Machine [J]. Chinese Journal of Scientific Instrument, 2007, 28 (12) : 2235-2238.


