Optimal design of high quality factor LC wireless passive pressure sensor
In view of the urgent need for accurate measurement and real-time monitoring of pressure signals in harsh environments, this paper proposes an optimal design of a high quality and strong coupling wireless passive pressure sensor based on LC resonant circuit design, and carries out simulation optimization analysis on the performance of the sensor. The coupling simulation and optimization design of the sensor with LC resonant circuit with different parameters are carried out. The simulation results show that in order to make the sensor have a high quality factor, the inductor on the sensor should not be too much, 11 turns is the best, and the inductor's line width and line distance are widened to 0.5mm, and the thickness is increased to 70'm, the sensor has a strong signal transmission ability and good stability. The design method studied in this paper provides a reference for the design and research of wireless passive pressure sensor with high precision and high stability.
0 Introduction
Some key parameters in harsh environments such as high temperatures are becoming increasingly important in automotive, aerospace and industrial applications [1-2]) Although some sensors perform well, most sensors are electrically charged, which limits their service life in real-world operating environments [3_6]. One possible solution to this problem is to power the sensor through magnetic field radiation, which does not require the sensor to be battery-powered; This approach also prevents disasters or failures in the system architecture. Passive pressure sensors such as high temperature sensor [8-9], intraocular pressure sensor [10-11] and humidity sensor [12] are suitable for wireless non-contact measurement in harsh environments, such as high temperature environment and medical environment, due to their stable performance and small size. Although these sensors can operate in harsh environments, they cannot achieve acceptable transmission efficiency and practical communication distance when touching external antennas. The sensor's quality factor describes the relationship between energy storage and energy consumption and is a measure of the energy transfer efficiency of a given LC resonant sensor. The higher quality factor facilitates the acquisition of power through inductive coupling and the transmission of data to an external receiver. As the quality factor of the sensor increases, its performance in terms of energy transmission will also increase. In addition, since electromagnetic oscillations require less energy consumption, the more energy stored in the sensor, the lower the energy consumption. Therefore, for LC resonant circuits, sensors with a high quality factor can improve the inductive transmission power, coupling strength, and coupling distance between the sensor and the test antenna. Moreover, in the design and manufacture of resonant (LC) wireless passive sensors, it is necessary to consider the electrical properties of the pressure sensor, including resistance, inductance and capacitance, which have a significant impact on the quality factor of the sensor.
The main objective of this paper is to design a wireless passive pressure sensor with high quality factor, whose electrical parameters are optimized for higher quality factor to improve the coupling strength between the sensor and the external antenna. The influence of inductance and resistance of inductor on quality factor of sensor is simulated and analyzed, and the approximate range of optimal electrical performance design parameters is obtained. HFSS simulation software is used to simulate and analyze these parameters, so as to obtain the optimal electrical performance design parameters, which provides the basis for high reliability sensor design.
1 Wireless non-contact measurement principle
The principle of wireless passive sensing and the design and coupling diagram of pressure sensor are shown in Figure 1. The sensor can perform non-contact pressure measurements obtained from an external reader antenna via a wirelessly coupled link. The LCR loop on the right represents the pressure-sensitive head, C2 is the pressure-sensitive variable capacitor,$2 is the planar spiral inductor, and Q is the parasitic series resistance in the loop. The left part is the test antenna end. The resistance of the test antenna and the test antenna coupled with the sensor coil is the resistance of the test antenna. The signal source of the test antenna end is <1. The mutual inductance coefficient between the test antenna and the sensor coil is Mo, in which the sensor is composed of a fixed inductor L and a flexible capacitor C, and forms a LC resonant circuit in series. When external air pressure is applied to the sensor, the capacitance value of the capacitor in the sensor LC resonant circuit changes. This translates into a change in the LC resonant frequency of the sensor, which translates a change in the pressure magnitude into a change in the resonant frequency. Then the resonant information of the remote sensor is reflected by reading the changes of the characteristic parameters of the input impedance at the test antenna end, and the pressure on the remote sensitive structure is finally obtained.
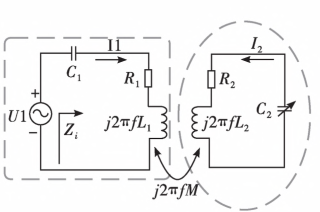
FIG. 1 Wireless passive sensing principle and design and coupling diagram of pressure sensor
The resonant frequency of the sensor can be expressed as:

Where: in and Cs are inductance and capacitance of the sensor, respectively.
The input impedance of the test antenna is shown in the figure:


Follow suit! 3), we can see that the amplitude of phase drop depends on the > and kernel, which determine the transmission performance and signal strength. However,L mainly depends on the planar size of the inductor and the coupling distance between the antenna and the sensor. Therefore, we can increase the coupling strength between the sensor and the test antenna by increasing the sensor's quality factor Q.
2 Matlab simulation analysis
2. Analysis of key influencing parameters of quality factor Q
According to the quality factor definition of LC series resonant circuit Q =(L/C#1/2/R), we can conclude that the sensor Q can be improved by reducing the resistance and capacitance of the LC resonant circuit, and also by increasing the inductance of the sensor. However, for the traditional wireless passive LC ceramic pressure sensor, if the capacitor design is too large, the capacitor cavity is easy to collapse; If the capacitor is designed too small, the sensitivity of the sensor will become low, which is not conducive to accurate pressure measurement. According to the calculation formula of quality factor, MatWb software is used to simulate the relationship between the inductance value, resistance value and series capacitance value of inductor and quality factor. Figure 2 shows the effect of the inductance value of the inductor coil and the capacitance value of the series capacitor on the quality factor. As can be seen from the figure, when the resistance value is fixed at 5%, the quality factor Q decreases with the increase of the capacitance value C, and gradually becomes constant. As the inductance value L increases, the quality factor Q increases. When the capacitance value is increased to a certain value (30 pF# in the figure), the quality factor basically does not change with the capacitance value, and the change is not obvious with the increase of the inductance value, so the capacitance value should not be too large in series. As shown in Figure 2, when the capacitance value is between 2 pF and 30 pF, it is conducive to the improvement of the quality factor. Therefore, the capacitance of the sensor is usually designed to be about 5 pF.
2.2 Influence of inductor parameters on inductance value and resistance value
When the capacitance is about 5 pF, the effect of inductance and resistance on the quality factor Q is shown in Figure 3. From Figure 3, we observe that the quality factor Q increases as the resistance R decreases, and the change caused by the resistance value is relatively large. Similarly, with the increase of inductance L, quality factor Q will also increase, but with the increase of inductance L, the transformation of quality factor Q tends to be stable. When the resistance is small, the quality factor is large, and with the increase of the inductance value, the Q value changes greatly. Therefore, when designing the inductor, the inductance value should be increased and the resistance of the inductor should be reduced as much as possible.
When the inductance value of the inductor coil is 2000 nH, the influence of the resistance value of the inductor coil and the capacitance value of the series capacitance on the quality factor is shown in Figure 4. The quality factor changes greatly with the change of the resistance value. When the resistance value is small, the Q value changes greatly with the reduction of the capacitance value. Therefore, relative to the increase of inductance, we should optimize for smaller resistance values.
In summary, the inductance value, resistance value and series capacitance of the inductor coil have an impact on the quality factor of the inductor coil, among which the resistance value has a relatively large impact on the quality factor. Although the increase of inductance value is conducive to the improvement of quality factor, the increase of inductance value will cause the increase of resistance value, so the design of inductance coil should be based on the reduction of resistance value, while increasing the inductance value as far as possible to reduce the resistance value of the inductance coil.
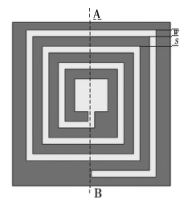
As shown in Figure 6. We observe that when the inner diameter of the inductor is fixed, the inductance of the inductor increases with the number of turns of the inductor. Moreover, the larger the line width and line distance, the more turns of the inductor coil, the more conducive to increasing the inductance.
3 Sensor structure design and simulation
According to the above MatWb simulation, when the number of turns of the inductor is increased to about 11 turns, the line width and line distance of the inductor are increased to about 0.5mm, and the thickness of the inductor is increased to 50'm, it is conducive to improving the quality factor Q of the sensor and the wireless signal transmission strength of the LC passive sensor. However, after the thickness of the inductor continues to increase, the resistance changes very little, continue to increase the thickness of the coil, the quality factor Q will not be significantly improved. In view of the above simulation results, we established the sensor and reading antenna model as shown in Figure 9 in the HFSS simulation software, and carried out coupling simulation of the wireless passive sensor by changing some parameters, so as to optimize its design. Its electrical parameters are represented by letters,sub - = and sub -y are the length and width of the base respectively,sub - h is the thickness of the base,a is the inner diameter of the coil,c is the thickness of the coil, w is the coil line width,s is the coil line distance, and N is the number of turns of the coil.
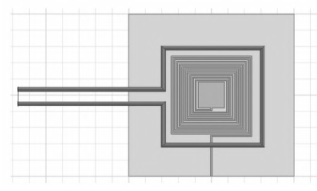
Model plane plan
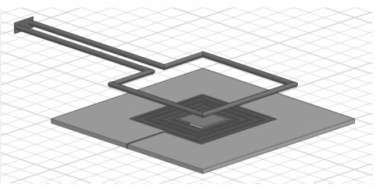
Model stereoplane
3.2 Optimization simulation design of coil turns
First, the coupling simulation optimization was carried out on the sensor with line width/line distance (6/sS is 0.4mm, and the number of turns is 7-15 turns, respectively). The simulation parameters were shown in Table 1, and the simulation diagram of the influence of the number of turns of the sensor and coil on the Sh amplitude of the sensor was shown in Figure 10. The line width and line spacing of the inductor coil are both 0.4 mm. As can be seen from Figure 10, the coupling effect between the antenna and the inductor coil is the best when the number of turns of the coil is 11. Combined with the previous analysis, it is known that this is because when the number of turns of the inductor coil increases to a certain critical point, although the inductance of the coil increases with the increase of the number of turns of the inductor coil, the inductance of the coil increases. But at the same time, the resistance value of the coil is also increasing, thus reducing the quality factor of the LC resonant circuit of the sensor. The simulation results show that the number of turns is 11 and the Q value is the largest, which is conducive to the extraction of the resonant information of the sensor.

Table 1 Sensor parameters with different coil turns
3.3 Coil line width/line distance optimization simulation design
Secondly, after knowing the optimal number of turns of the coil, the inductor with different line width/line spacing is used for wireless coupling simulation optimization. The simulation parameters changed are shown in Table 2. The number of turns of the inductor is 11, while the line width/line distance! 6/\) varies from 0.3 to 0.6mm, while other parameters remain unchanged. The simulation of Sn amplitude change is shown in the figure. After obtaining the trend of Sn amplitude change with it, it can be found from the figure that the line width/line distance (6S ranges from 0.3 mm to 0.5 mm) has the largest trend of change and reaches the deepest near it. Beyond 0.5 mm, the change is minimal, especially after 0.55 mm. This is consistent with the previous simulation results, that is, the larger line width and line spacing make the resistance of the inductor smaller, and the quality factor Q of the resonant circuit is improved, so that the resonant point of the sensor is more obvious. However, the change of resistance caused by continuous increase is extremely small, and can not have a significant effect on the improvement of quality factor Q. Therefore, combined with the result analysis of FIG. 8 and FIG. II, and for the miniaturization of the sensor, the coil line width/line distance can be selected at about 0.22.
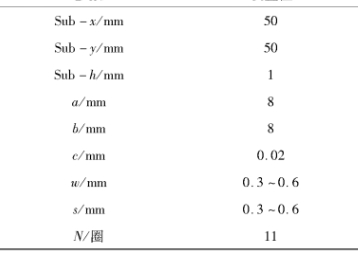
Table 2 Sensor parameters with different coil turns
3.4 Coil thickness optimization simulation design
From the previous analysis, we can see that when the line width and line distance of the inductor coil increase to 0. 522, the thickness of the inductor coil increases to 50, the resistance value of the inductor coil is already very small, continue to increase its thickness, the size of the resistance basically has no change, and will not have a significant impact on the quality factor of the sensor. Based on the above analysis, on the basis of the coil model whose front width/line distance (6/s) is 0.4mm and the number of turns is I0, the coil thickness is changed from 0.0I-0.0822, and the coupling simulation is carried out, and other parameters are unchanged. The simulation parameters are shown in Table 3. As can be seen from Figure II, the coupling effect between the antenna and the inductor coil becomes better and better with the increase of the thickness of the coil. This is because when the thickness of the inductor coil increases, the resistance value of the coil decreases, thereby improving the quality factor of the LC resonant circuit of the sensor and facilitating the extraction of the resonant information of the sensor. However, according to the analysis of Figure 7, when the coil thickness increases to 50, the resistance change caused by it is very small. As shown in Figure I2, when the coil thickness is 0.07mm, the coil thickness continues to increase, and no more obvious coupling effect can be obtained, which is of little significance. Therefore, we can set the coil thickness to 70.
4 Conclusions
This paper introduces an optimal design of wireless passive pressure sensor with high quality factor. The influence of inductance and resistance on quality factor of sensor is analyzed by simulation. It is found that the resistance of inductor has greater influence on quality factor than inductance. Further coupling simulation is carried out on the influence of these key parameters on the Q value. The simulation results show that when designing the wireless passive LC sensor, after the inner ring size of the metal layer is fixed, the number of turns of the inductor should not be too many in order to improve the quality factor and enhance the coupling effect, and 11 turns is the best. The line width and line spacing should be selected at about 0.5mm, and the coil thickness should be selected at about 70. In this way, we can optimize the wireless passive pressure sensor, improve the sensor quality factor, and then improve the quality factor can improve the wireless signal transmission strength of LC passive sensor.
References:
[1] JOHNSON R W,EVANS J L,JACOBSENP , ct at. changing automotive environment: high — temperature cmctronics [ J -. IEEE Transactions on Electronics Packaging Manufacturing, 2005 , 27(3) &164 - 176.
[2] WERNER M R, FAHRNER W R. Review on materials,microsensors, systems and devices for high — temperature and harsh — environment applications [ J -. IEEE Transactions on Industrial Electronics, 2001, 48(2) &249 -257.
[3]- XIE F,WANG B, WANG W, ct t. Continuous towing micro — reactor for aqueous reaction at temperature high than 100o C [ J ]. Biomicroeuidics, 2013, 7 (3) : 98-103.
[4] Song Zijun, Zhang Cong, Zhao Yong, et al. A Mount-type MEMS pressure sensor for harsh Environment [J]. Measurement and Control Technology, 2019, 38(7):5.
[5] Wu Linghui, Xu Dong. Design of high temperature and harsh environment pressure sensor [J] • Applied Science and Technology, 2018, 45(4) : 5.
[6] Qiao Dongpo, Wang Chao. Design of wireless pressure sensor based on battery power [J] • Electronic World, 2016(17) : 2.
[7] ARSHAK K, JAFER E. Modeling of wireless based sensors data acquisitions systems used foc esophaaus monitcOng [ J -. Sensors & Actuators A Physical, 2008 , 142(1) &390 -397.
[8] Jia Mangu, Xiong Jijun, Li Chen. Design and Simulation of HTCC passive Vibration Sensor with High temperature resistance [J]. Sensors and Microsystems, 2019,40(9) : 26-29. (in Chinese)
[9]- VYSOTIEAY E, RIEAKHANOV R, SIGALAEV S, ctat. Sensitive elements of high temperature pressure sensors formed from a doped polycwsellinc diamond [ J MateeoaesScoenceFoeum, 2021, 1031:178-183.
[10] Luo Jian. Signal acquisition circuit design of LC wireless passive IOP sensor [D]. Wuhan: Huazhong University of Science and Technology, 2019.
[11] PHAN A, TRUONG P, SCHADE C, ct at. InvestigaWon of long term drift of an intraoculac pressure sensoc[J]. Microsystem Technolooics, 2021,7:1-7.
[12] Wang Yimeng, Shu Haowen, Han Xiuyou. Research on high precision silicon integrated optical temperature sensor [J]. Chinese Optics,2021,14(6) : 7. (in Chinese


